Introduction
The design of offshore and nearshore structures requires accurate assessment of hydrodynamic forces due to waves and currents. ANSYS Mechanical offers a dedicated module, the Offshore Module, which enables engineers to simulate these effects directly in the structural analysis environment.
The Offshore module, based on the OCEAN APDL command library, is accessible from the Add-ons ribbon in ANSYS Mechanical (Figure 1). It supports linear and non-linear wave theories, enabling the simulation of wave-current interactions on complex 3D geometries without the need for specialized CFD software.

Figure 1: Offshore module in ANSYS Mechanical
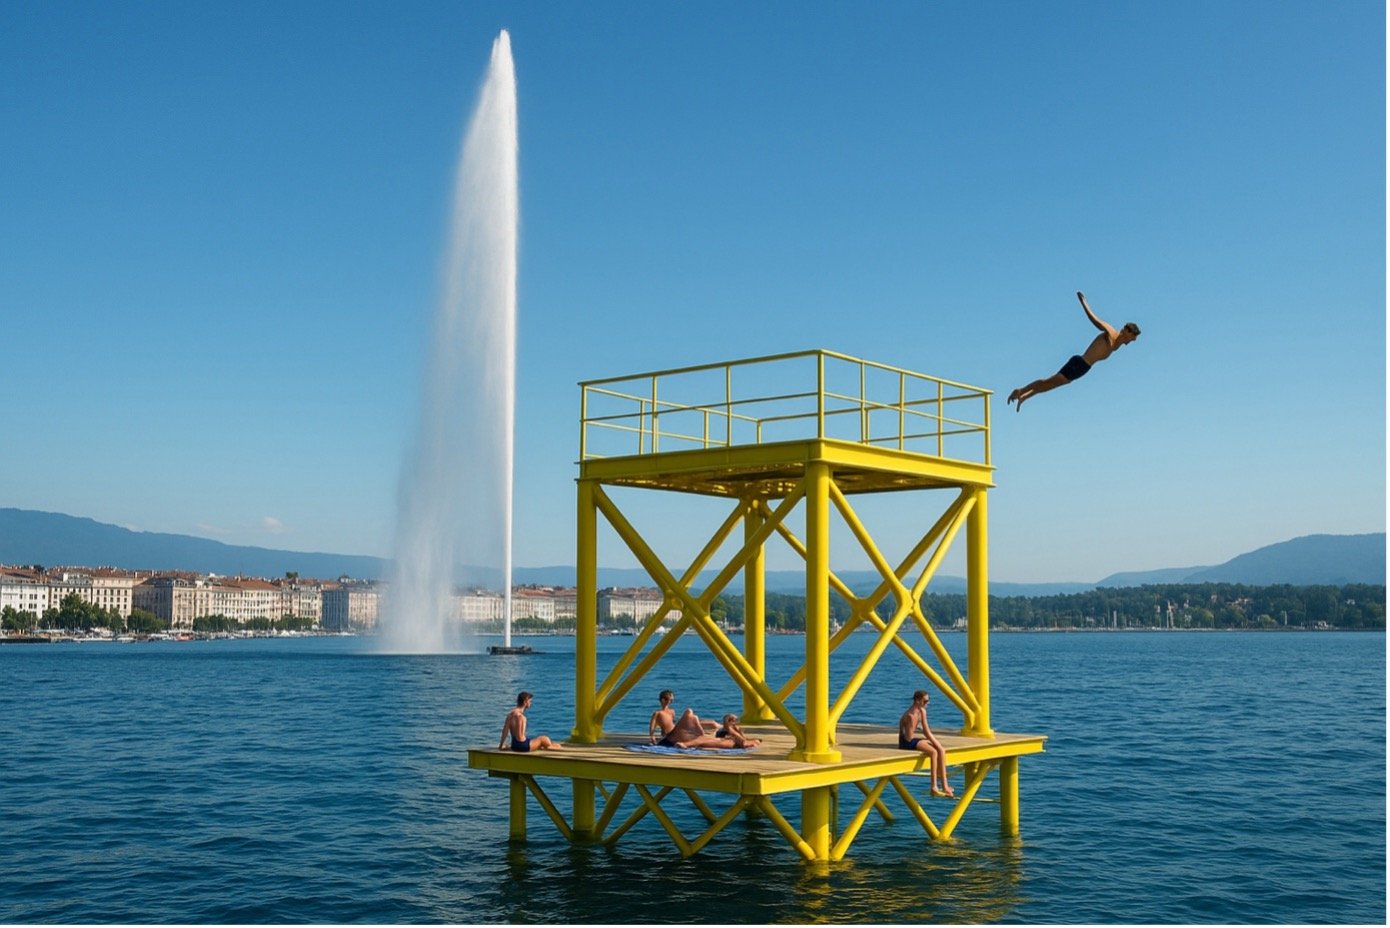
In this study, the capabilities of the Offshore module are demonstrated through wave loading analysis on a jacket structure immersed in Lake Geneva, the significant body of water closest to the DAES offices.
Note: the effect of the Water Jet has not been taken into account!
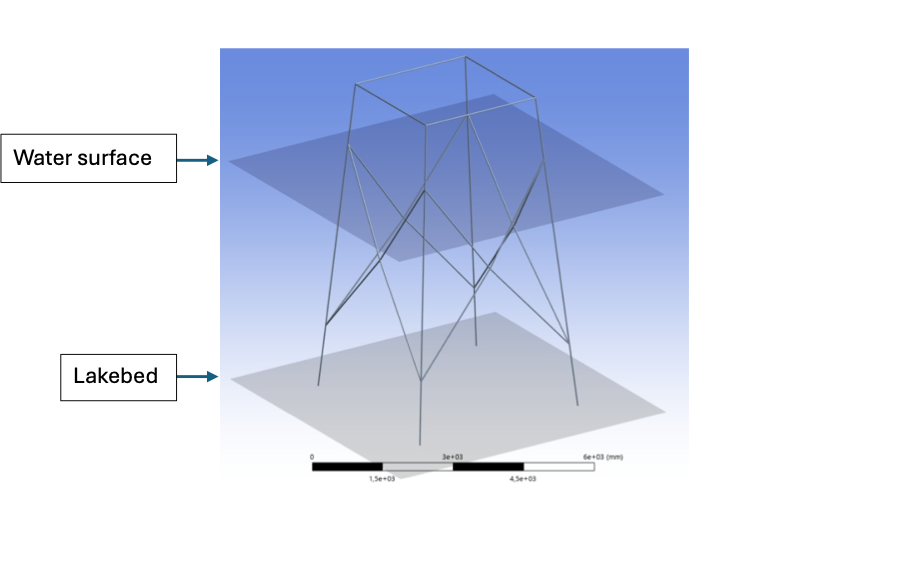
Figure 2: Model considered for wave calculation
Setting up the case study
Site description
Lake Geneva is an interesting case study due to its geometry, wind exposure and bathymetry. Its maximum depth reaches around 307 m in the central zone. The prevailing wind comes from the northeast, aligned with the main axis of the lake, which channels the waves towards the narrower, shallower bay of Geneva, favoring their amplification (see Figure 3).
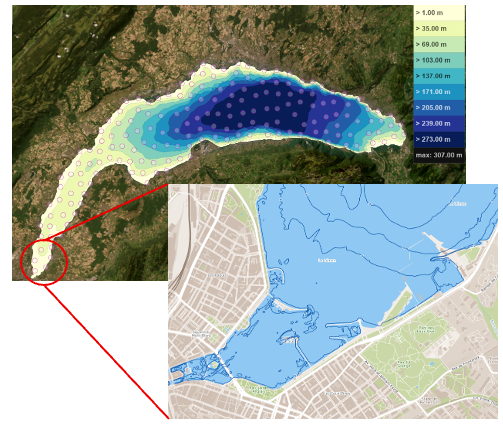
Figure 3: Bathymetry of Lake Geneva and zoom near Geneva
For this example, we consider that the structure is located in this bay, where the lake flows into the Rhône, adding a significant current.
Description of the structure
As shown in Figure 2, the structure studied is a four-legged jacket, measuring :
- 7 m high (including 2 m above mean water level)
- 4 m wide
Modeling assumptions :
- Element type : BEAM188
- Water depth: 5 m
- Global vertical axis: z axis
- Boundary conditions: complete embedment at base of legs (no soil-pile interaction for simplicity)
Although ANSYS can model pile-soil interaction (useful for deep foundations), this feature has not been used here to simplify the study.
Definition of wave conditions
The Offshore module is added to the Solution branch of the model (see Figure 6). Some parameters are set automatically, but the choice of wave theory and environmental conditions must be carefully made by the user.
Two main approaches are possible:
- Regular wave (single): for analysis at the ultimate limit state (ULS)
- Wave spectrum: to represent random sea states (fatigue)
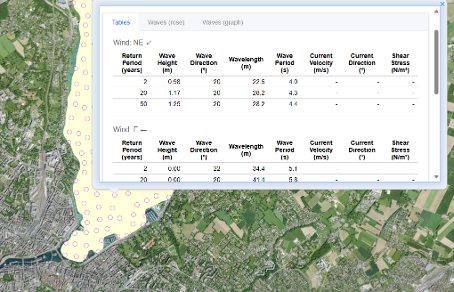
In this analysis, extreme conditions were extracted from the Swisslake.net database for a 50-year return period in the Bay of Geneva:
- Maximum wave height: Hmax = 1.25 m
- Wave period: T = 4.4 s
Figure 4: Extreme conditions in the Bay of Geneva
In view of the
a depth and wave parameters, the intermediate depth regime applies. Suitable theories are :
- 5th order current function
- Stokes of order 3
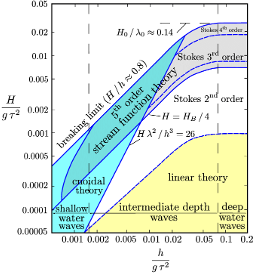
Figure 5: Validity range of wave theories
The simulation is therefore carried out using current function theory, with a 180° phase shift to fully capture the wave crest (complete trough-peak-peak cycle).
It is also important to check that the wavelength exceeds the width of the structure, so that it is fully subjected to the movement of the wave.
Figure 6: Definition of wave parameters
Current
In the absence of local measurements, a surface current velocity of 1 m/s is assumed, representing the combined effects of wind and Rhône flow.
The current is assumed to be aligned with the wave (NE orientation), but a misalignment could easily be modeled.
Advanced parameters (hydrodynamic coefficients, added masses, etc.) exist but are not covered here.
A transient analysis is performed over a full wave period(4.4 s).
Results and post-processing
The Offshore module provides several hydrodynamic quantities via customized outputs:
- fluid speed
- acceleration
- dynamic pressure
- wave amplitude
- hydrodynamic forces
(Table 1: available variables – retained as is)
Wave elevation
Figure 7 shows the evolution of the free surface over time.
The non-linear wave features :
- a crest at +720 mm
- a trough at -530 mm
The total height corresponds to :
H = 720 – (-530) = 1250 mm = 1.25 m
The wave is therefore correctly reproduced.
Speed profiles
Figure 8 shows the distribution of water particle velocities:
- Current only” profile: from 1 m/s at the surface to 0 m/s at the bottom
- Wave + current” profile: maximum speed ≈ 2.2 m/s at crest → constructive interaction between wave and current
Hydrodynamic forces and structural response
The tangential hydrodynamic forces (Fx) on the beam elements are shown in Figure 9.
Results :
- periodic variation in accordance with wave loading
- maximum and minimum values plotted over a cycle
Moving the structure
Figure 10 shows the total displacement (amplified ×4.3 for visualization).
The deformation mode corresponds to the expected bending behavior under combined wave + current loading.
Constraints
Figure 11 shows the combined stresses in the beams.
Result:
- maximum stress ≈ 250 MPa at embedded base
→ The structure will withstand the extreme event if it is made of steel with a limit greater than 250 MPa.
Conclusions
This study demonstrates the use of ANSYS Mechanical’s Offshore module to simulate the hydrodynamic forces due to waves on an offshore structure immersed in Lake Geneva.
Key points:
- Current function theory effectively models non-linear waves in lake environments
- The Offshore module provides detailed results (speeds, accelerations, pressures, forces) without the need for CFD.
- Wave-current interaction generates a maximum surface velocity of around 2.2 m/s, strongly influencing the structural response.
This workflow can be extended to :
- pile-soil interaction
- fatigue analysis
- offshore and nearshore design optimization